by Andreas Bayerl, Stefan Kluge, Maximilian Beichert, Florian Stahl
Data Science as a field is “multidisciplinary” (NASEM 2017, p.1) and best understood as an “umbrella term to describe the entire and complex and multistep processes used to extract value from data (Irizarry 2020). Broadly speaking it is defined as “the study of extracting value from data” (Wing 2019) or in laymen’s term: Data Science is about extracting something of value from messy, complex large datasets.
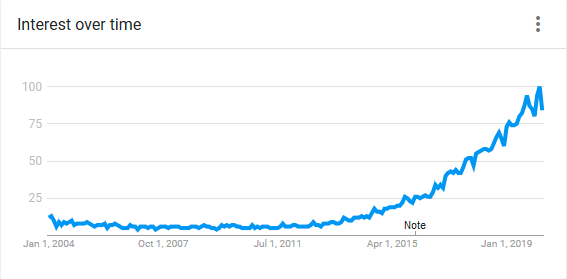
The term “Data Science” per se is not new, as back in the last century in 1997 there were some initiatives from a University of Michigan Professor to change the Statistics discipline’s name to Data Science (Jeff Wu). But it wasn’t until 2012, sparked partly by the ever-increasing amount of available data, but especially by a Harvard Business Review article titled “Data Scientist: The Sexiest Job of the 21st Century” (Davenport & Patil, 2012) that the term’s popularity gained some momentum. This finds confirmation in a Google Trends Analysis that we conducted, which shows the worldwide search volume of “Data Science” since 2008 until today.
Naturally, both the Business (see e.g. Bicher et al. 2017) as well as the Economics world (see e.g. Einav & Levin 2014) offer new data sources that just wait to have value extracted from them. The methods used in Data Science are not necessarily new and are in fact taught all over the world right now in classes called something like Operation Research, Management Science, Simulation Analysis or Econometrics. But, Holsapple et al. (2014) come to the conclusion that the availability of large data sets in business led to such techniques becoming more important throughout all fields of management.
On the one hand Data Science is about extracting knowledge and insight from data. For this purpose, technologies, processes and systems borrowed from Computer Science are used. We will cover this side, namely the “management and processing of data” (NASEM 2017, p.2) in the first part. This includes, data preparation, databases and warehousing as well as data cleaning and potential feature extraction. This backend part deals with “hardware, efficient computing and data storage infrastructure” (Irizarry 2020).
On the other hand, after data was extracted, stored and processed, Data Science covers “analytical methods and theories for descriptive, predictive and prescriptive analysis” (NASEM 2017) as well as optimization. The part involves for example Natural Language Processing for text analytics, Computer Vision for image analysis, and machine learning algorithms, or mathematical optimization to arrive at results. Thus, this frontend part is more geared towards the analysis of the extracted data (Irizarry 2020).
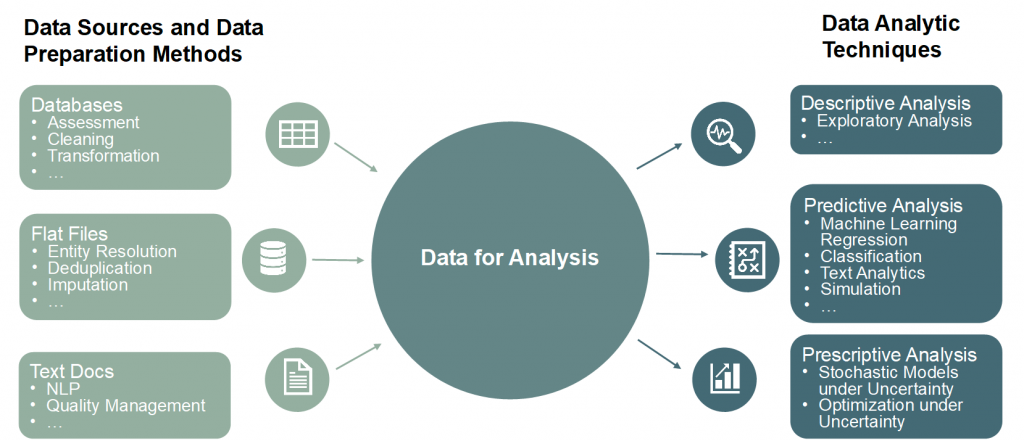
Data Sources and Data Preparation Methods
The foundation of data analytics is having data that are of sufficient quality, appropriately organized for the analysis task at hand. Unfortunately, data seldom arrive in a suitable state, and a necessary first step is getting them into a proper form to support analysis. This step has been estimated to occupy up to 80 percent of the total analysis time according to a survey of data scientists by CrowdFlower (Biewald 2015). This intensive overhead cuts down on the effective productivity of data analysts – it is helpful to be aware of techniques, that assist analysts with those tasks.
In larger projects it is also useful to distinguish between the work of data engineers who deal with hardware, efficient computing, and data storage infrastructure and the work of data analysts and machine learning engineers who wrangle, explore, quality assess, fit models to data, perform statistical inference, and develop prototypes, who build and assess prediction algorithms and make the solution scalable and robust for many users. A sequence of three steps can help the data engineer to prepare data for analytic tasks, providing a basic methodology:
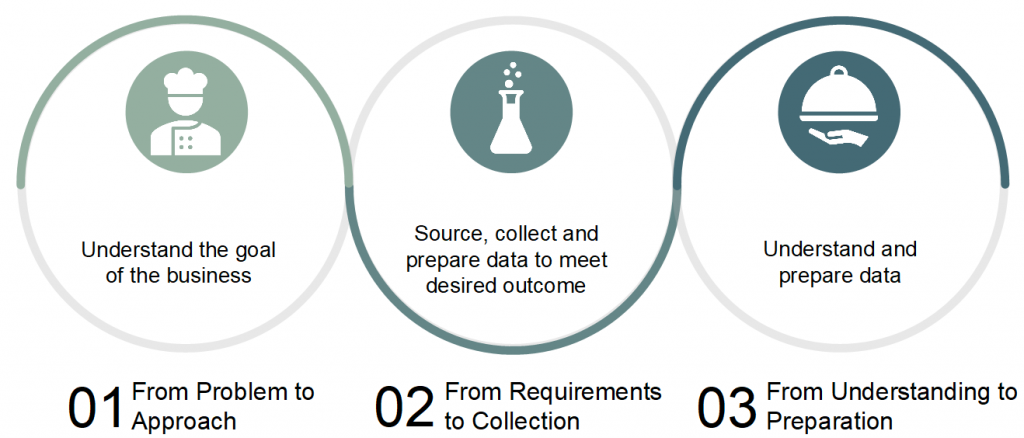
Figure 3: Overview of the three fundamental steps to prepare data for analysis
1. From Problem to Approach
Asking the right questions as a data scientist starts with understanding the goal of the business, it is part of why it is a multidisciplinary field. The right questions will inform the ideal analytical approach for solving the problem, which may include statistical analysis, predictive modelling, descriptive modelling or machine learning models like classification.
2. From Requirements to Collection
If the problem that needs to be resolved from step 1 is the ‘Recipe’ and data is the ‘ingredient’, then the data scientist needs to know which ingredients are required, how to source and collect them, and how to prepare the data to meet the desired outcome. In this stage, the data requirements are revised and decisions are made as to whether or not the collection requires more data. Once data ingredients are collected, the data scientist would have a good understanding of what they’d be working with.
Data could come from companies internal data sources like machine sensory outputs or logfiles, from existing public data repositories, web-scraping or APIs (e.g. real-time Twitter data). The data requirements and data collection stages are extremely important because the more relevant data you collect, the better your model.
3. From Understanding to Preparation
To understand data the scientist uses descriptive statistics to find correlations in order to remove redundancies. Missing values evaluation, finding invalid values and formatting data is also done. Staying with the cooking analogy data preparation is similar to washing freshly picked veggies in so far as unwanted elements are removed. Together with data collection and understanding, data preparation is the most time-consuming aspect of data science projects taking up to 70% or even 90% of the overall project time.
Data Analytic Techniques
Interest in machine learning and artificial intelligence has surged in recent years with these buzzwords garnering widespread recognition in both business practice and research. Machine learning, or the capability of computers to learn and generate insights from data without being told specifically what to look for, belongs to the field of artificial intelligence (Balducci & Marinova, 2018).
By making use of the patterns found in most nonrandom data, a machine learning algorithm derives information on the properties of training data to learn a generalizable model (Segaran 2007). Thereby, it uses the aspects it considers important to consequently make predictions for previously unseen data (Segaran 2007). While machine learning methods that train using an exemplary set of inputs and corresponding outputs are cases of supervised learning, unsupervised learning methods do not have labeled examples to learn from, requiring the computer to find an unknown structure in a given data set (Balducci & Marinova, 2018).
Classification techniques are regularly employed to make sense of both structured and unstructured data. Thereby, the lack of flexibility of rule-based approaches is solved through machine learning methods (Segaran 2007). Applications of machine learning to classification tasks allow for the recognition of complex patterns, the distinction between objects dependent on their patterns, and finally the prediction of an object’s class (Huang & Luo 2016). A classifier is given some set of data with items, their features, and class labels from which it learns with the goal of classifying previously unseen data.
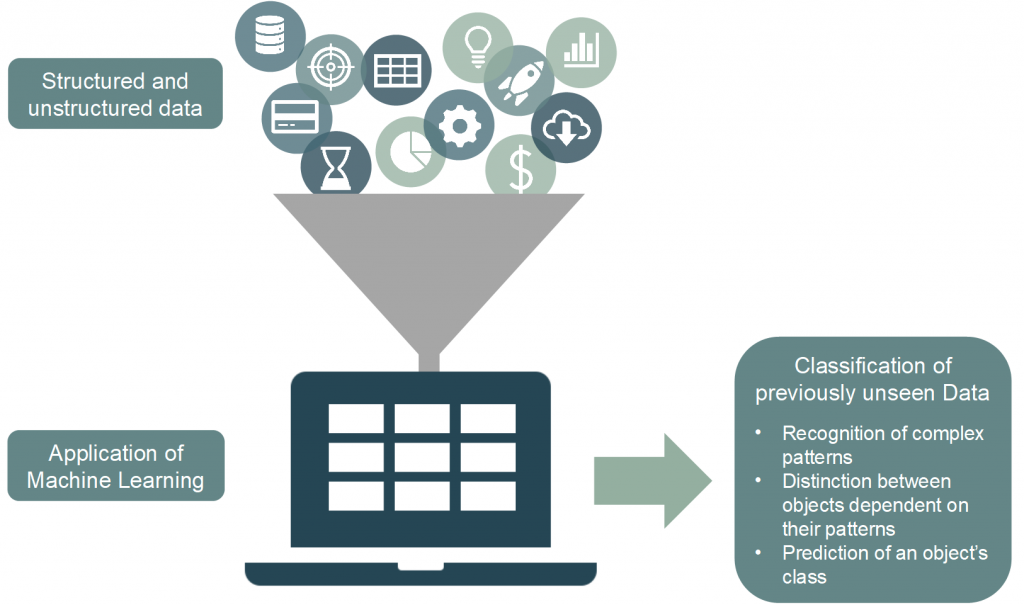
Figure 4: Application of machine learning to classification tasks
All classification methods aim to assign an input vector to a finite number of discrete and usually disjoint classes (Bishop 2006). In general, classification often finds its use in the preprocessing and automatic organization of data, which allows for a quick and accurate retrieval of data points in large databases (Datta et al., 2008). Common machine learning classification techniques include neural networks and decision trees. All neural networks contain a set of neurons, or nodes, that are connected by synapses (Segaran 2007). Each synapse has an associated weight that determines the degree of influence the output of one neuron has on the activation of another. Neural networks can start with random weights for the synapses and learn through training (Segaran 2007). Most commonly, the network is fed an exemplary input and corresponding output and adjusts the weights of each synapse proportionally to their contribution to the nodes in the output layer, a process called backpropagation (Segaran 2007). The training occurs slowly, allowing the classification of an item to improve with the number of times it is seen and preventing an overcompensation in response to noisy data (Segaran 2007). Overall, neural networks capture the interdependence between features by allowing the probability of one feature to vary with the presence of others (Segaran 2007). Additionally, they are applicable to cases with a continuous stream of training data due to their incremental training (Segaran 2007).
George et al. (2016) demonstrate that data volume and data variety hold potential for future research. According to the scholars, data volume as well as data variety can be transposed as data scope and data granularity for management research. The two components deliver better answers to old questions and create new questions to be answered.
Data analytical techniques in the context of business and economics are used for various research directions. For instance, in a retailing context Bayesian analysis techniques, such as data borrowing and hierarchical modelling are employed to derive most accurate prediction models (Bradlow et al. 2017). Instead of using supervised machine learning with the help of a recurrent neural network clickstream data can be now analyzed in a completely new fashion in order to predict online shopping behavior (Koehn, Lessmann & Schaal, 2020). The researchers suggest that such behavior prediction might save marketing costs and enhance revenue. Natural language processing could be integrated by examining impact of luxury brand’s social media marketing on customer engagement (Liu, Shin, & Burns, 2019). Bhatia (2019) outlines computational techniques for predicting perceptions of risk. Sentiment analysis has already been used in many settings to forecast stock markets (e.g.: Zheludev et al., 2014). Furthermore, Data Science in a business and economics context can be employed in order to foresee critical situations for corporate or even administrative institutions in social networks (Herhausen et al. 2019). In a more economic relevant context sales can be attributed to the quality and valence of reviews (Ludwig et al. 2013). Data Science is also able to determine how effectively brand communication deliver the intended message it should transport (Homburg et al. 2015).
